Overview
All prices are displayed in Australian Dollar (AUD)
Active properties
The number of properties, with or without bookings, that are available to book for at least one night during the month.
108
-- %
Average Daily Rate
The Average Daily Rate (ADR) for properties in the area is calculated by dividing the total revenue for the month by the number of nights booked.
$253
Occupancy Rate
The occupancy rate for properties in the area is calculated by dividing the number of nights booked for the month by the number of nights available to book.
52%
Annual Revenue
The annual gross revenue for properties in the area. It doesn't include any fees or expenses, like cleaning fee or Airbnb fees.
$47,275
RevPAR
The RevPAR (revenue per available room) for properties in the area is calculated by dividing the total revenue for the month across all properties by the number of nights available to book. It's used to compare the efficiency of properties in the area.
$130
-
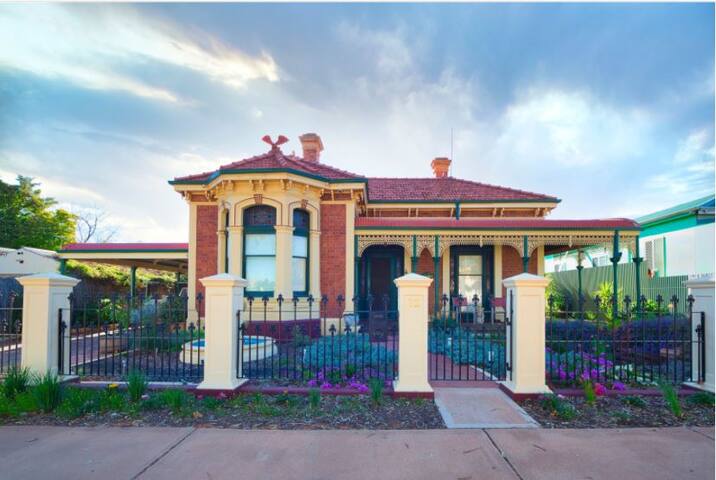 4.9 (20)# 1316$386nightannual revenueoccupancy
 -
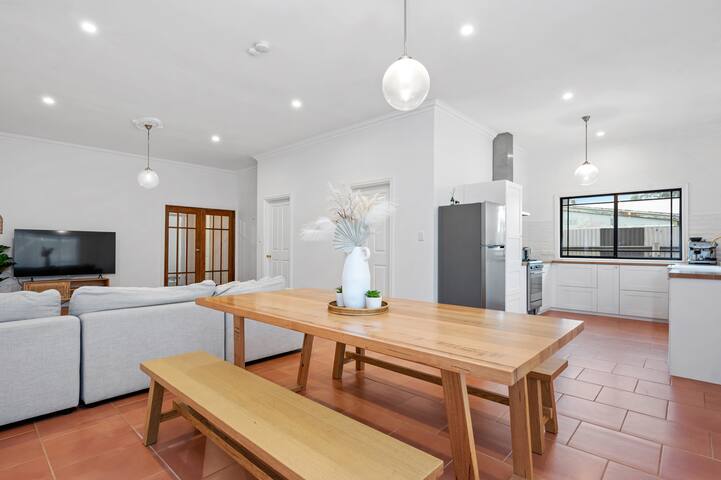 4.8 (30)# 2427$357nightannual revenueoccupancy
 -
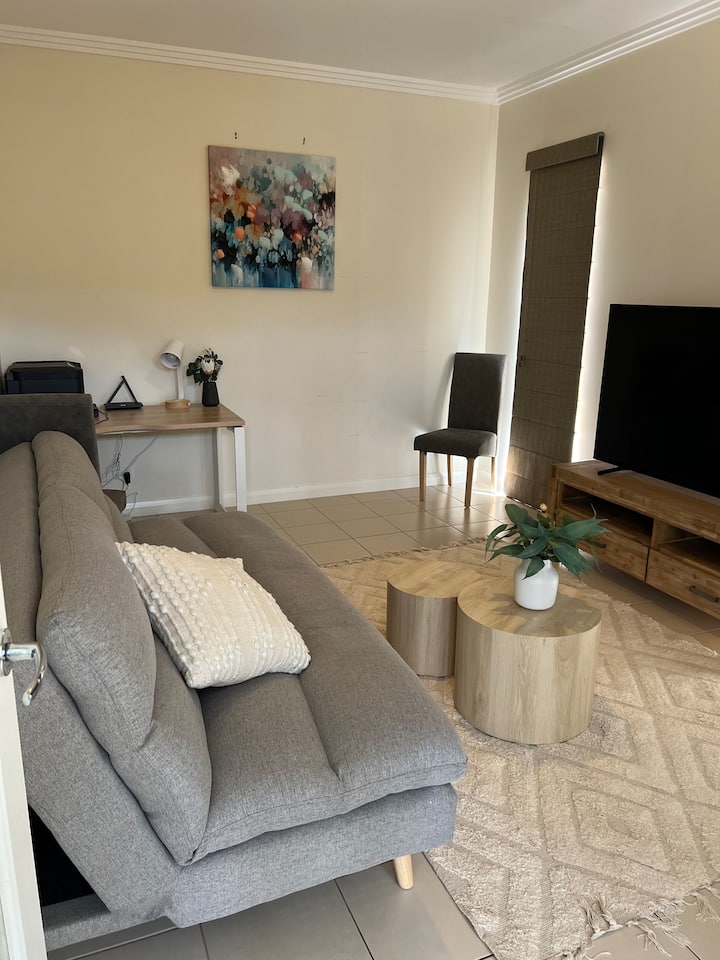 4.8 (25)# 3428$304nightannual revenueoccupancy
 -
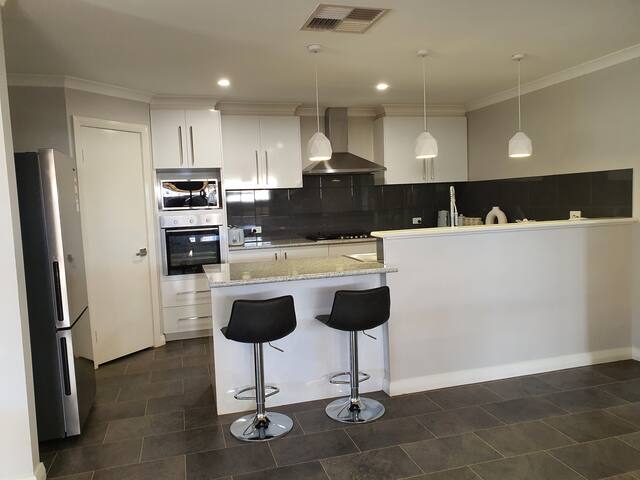 4.95 (44)# 4428$275nightannual revenueoccupancy
 -
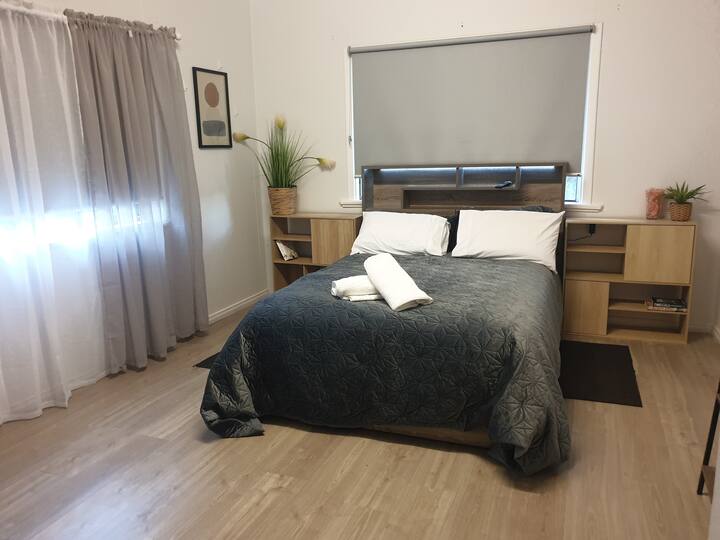 4.94 (63)# 541.55$255nightannual revenueoccupancy
Property size distribution
Demand Insights
Nights Booked
Total nights booked for all properties in the area, calculated by summing individual property bookings. This data can be used to analyze if certain months have higher demand than others, regardless of the number of properties available.
Bookings Created
The number of bookings created each month for properties in the area, regardless of when the actual stay is scheduled. This data is useful for understanding booking patterns and trends, helping anticipate busy periods and adjust marketing strategies accordingly. It can also indicate the overall popularity and demand for the area over time.
Amenities
Amenity
Properties
Revenue with
Revenue without
Revenue difference
Actions
Patio or balcony
45
(41.7%)
$133,185
$71,251
$61,935
(86.9%)
Washer
102
(94.4%)
$155,522
$101,468
$54,054
(53.3%)
Dryer
47
(43.5%)
$144,449
$90,859
$53,590
(59.0%)
Air conditioning
101
(93.5%)
$135,784
$85,829
$49,955
(58.2%)
Crib
23
(21.3%)
$113,845
$73,712
$40,133
(54.4%)
Kitchen
104
(96.3%)
$127,835
$89,726
$38,109
(42.5%)
Outdoor furniture
56
(51.9%)
$118,427
$81,133
$37,294
(46.0%)
Workspace
53
(49.1%)
$124,254
$99,425
$24,829
(25.0%)
Wi-Fi
101
(93.5%)
$125,854
$102,568
$23,286
(22.7%)
Indoor fireplace
27
(25.0%)
$112,044
$99,113
$12,931
(13.0%)
BBQ
51
(47.2%)
$56,464
$90,912
-$34,448
(-37.9%)
TV
104
(96.3%)
$66,935
$101,788
-$34,853
(-34.2%)
Heating
87
(80.6%)
$49,085
$87,916
-$38,831
(-44.2%)
Breakfast
6
(5.6%)
$54,379
$94,361
-$39,982
(-42.4%)
Pool
15
(13.9%)
$58,602
$104,194
-$45,592
(-43.8%)
Backyard
69
(63.9%)
$49,615
$104,409
-$54,794
(-52.5%)
Ratings
Rating Count
Average Rating
