Overview
All prices are displayed in Australian Dollar (AUD)
Active properties
The number of properties, with or without bookings, that are available to book for at least one night during the month.
622
-- %
Average Daily Rate
The Average Daily Rate (ADR) for properties in the area is calculated by dividing the total revenue for the month by the number of nights booked.
$297
Occupancy Rate
The occupancy rate for properties in the area is calculated by dividing the number of nights booked for the month by the number of nights available to book.
50%
Annual Revenue
The annual gross revenue for properties in the area. It doesn't include any fees or expenses, like cleaning fee or Airbnb fees.
$53,146
RevPAR
The RevPAR (revenue per available room) for properties in the area is calculated by dividing the total revenue for the month across all properties by the number of nights available to book. It's used to compare the efficiency of properties in the area.
$147
-
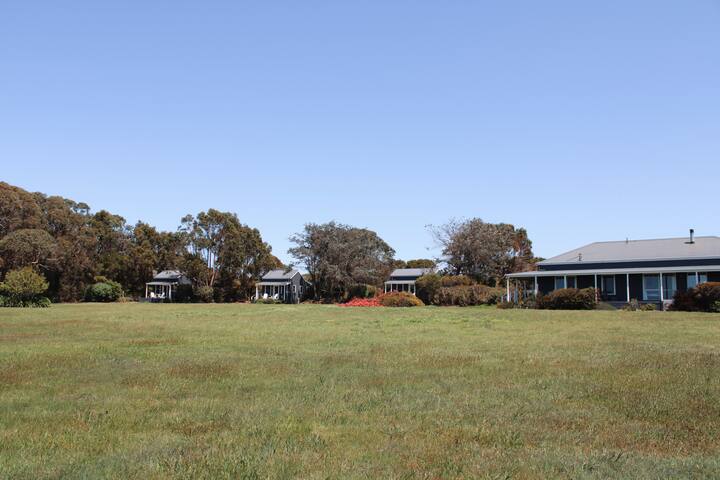 4.93 (30)# 18516$1,162nightannual revenueoccupancy
 -
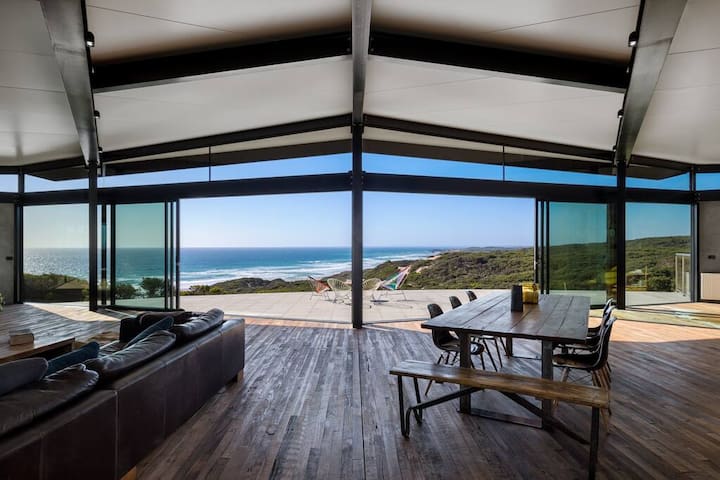 4.97 (156)# 243.510$1,115nightannual revenueoccupancy
 -
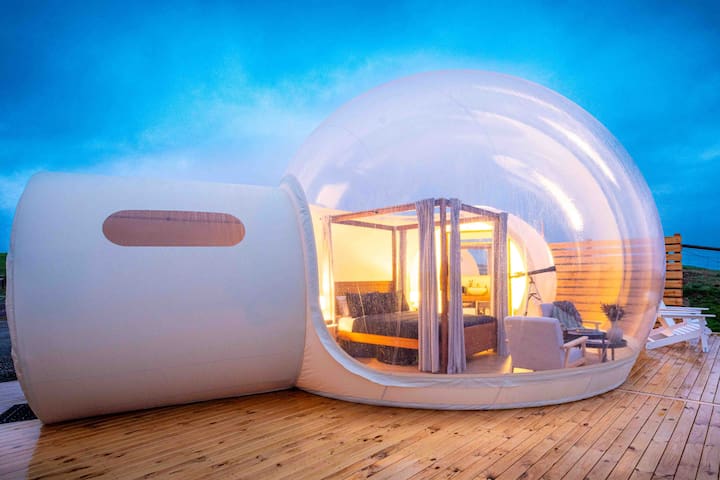 4.97 (152)# 3112$672nightannual revenueoccupancy
 -
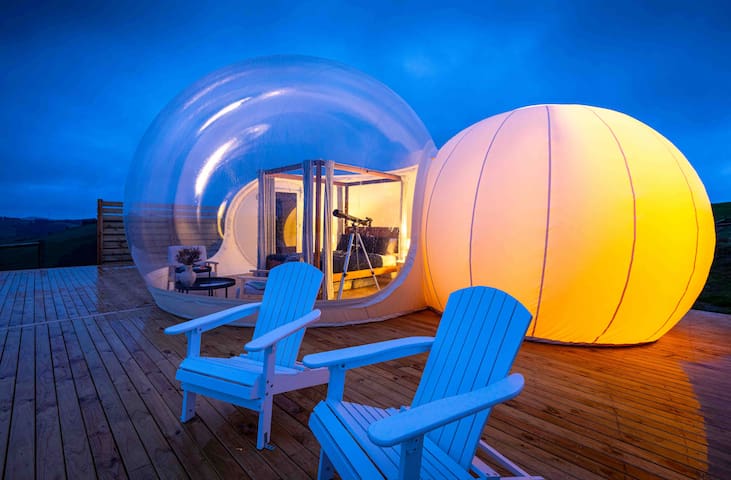 4.98 (156)# 4112$676nightannual revenueoccupancy
 -
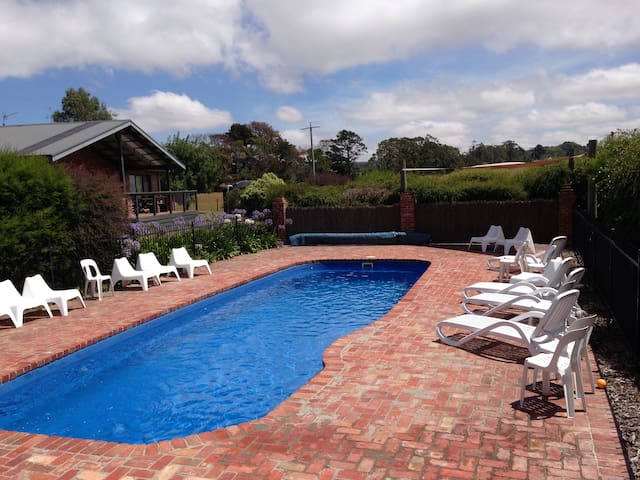 4.86 (21)# 54220$772nightannual revenueoccupancy
Property size distribution
Top property managers
Name
Property count
Rating count
Booked properties
Demand Insights
Nights Booked
Total nights booked for all properties in the area, calculated by summing individual property bookings. This data can be used to analyze if certain months have higher demand than others, regardless of the number of properties available.
Bookings Created
The number of bookings created each month for properties in the area, regardless of when the actual stay is scheduled. This data is useful for understanding booking patterns and trends, helping anticipate busy periods and adjust marketing strategies accordingly. It can also indicate the overall popularity and demand for the area over time.
Amenities
Amenity
Properties
Revenue with
Revenue without
Revenue difference
Actions
Crib
136
(21.9%)
$176,994
$80,355
$96,639
(120.3%)
Parking
582
(93.6%)
$138,608
$73,170
$65,438
(89.4%)
Backyard
504
(81.0%)
$114,185
$72,869
$41,316
(56.7%)
Outdoor furniture
340
(54.7%)
$114,848
$76,621
$38,227
(49.9%)
Dryer
198
(31.8%)
$106,355
$72,766
$33,589
(46.2%)
Washer
500
(80.4%)
$100,592
$72,474
$28,118
(38.8%)
Air conditioning
540
(86.8%)
$118,658
$92,438
$26,220
(28.4%)
Heating
575
(92.4%)
$82,053
$72,095
$9,958
(13.8%)
Wi-Fi
415
(66.7%)
$97,329
$90,042
$7,287
(8.1%)
Indoor fireplace
354
(56.9%)
$82,086
$79,995
$2,091
(2.6%)
Patio or balcony
468
(75.2%)
$83,542
$81,482
$2,060
(2.5%)
TV
572
(92.0%)
$66,306
$67,475
-$1,169
(-1.7%)
Workspace
178
(28.6%)
$81,048
$99,208
-$18,160
(-18.3%)
Breakfast
25
(4.0%)
$75,148
$97,496
-$22,348
(-22.9%)
Waterfront
20
(3.2%)
$52,744
$87,096
-$34,351
(-39.4%)
Hot tub
19
(3.1%)
$48,447
$89,223
-$40,776
(-45.7%)
Kitchen
586
(94.2%)
$40,642
$89,030
-$48,388
(-54.4%)
BBQ
483
(77.7%)
$20,996
$79,898
-$58,902
(-73.7%)
Beachfront
29
(4.7%)
$32,493
$100,054
-$67,561
(-67.5%)
Ratings
Rating Count
Average Rating
